Preface
The Inventory and Compatibility appraisal service (InventorySvc) on Windows is interesting.
As its name suggests, this service (let’s call it “the appraisal service” hereinafter) has something to do with the compatibility workarounds that Microsoft maintains for old applications (this article on MSDN is probably relevant).
Unfortunately, the appraisal service is also a big player when it comes to unexpected, unexplainable CPU hogging on recent versions of Windows.
The symptom? Simple - just open Task Manager and observe that an svchost.exe process pegging a CPU core for multiple minutes.
I have been a victim of the appraisal service pegging my CPU for literally years. It occurs periodically, but not frequently enough for me to wield my big ETW sword at it – I know it would usually take multiple hours (if not days) for me to track down the root cause. Who knows how long it would take Microsoft to fix it even if I manage to report it… I am a lazy person with many higher-priority daily tasks to accomplish, and a system process using some amount of CPU resource on my machine every a couple of days is not really the worst thing that can happen in my daily life.
What finally made me sit down and debug this issue was a recent behavioral change in Microsoft Defender: Defender would sometimes peg all of my cores for several minutes while performing background scanning, which was seemingly triggered by the appraisal service running and pegging a core! Sure, as a poor Windows user, I can probably tolerate yet another important system service using my CPU, but it is simply outrageous that it (Microsoft Defender) deems itself so important that using all cores for minutes is OK. Worse, my poor laptop CPU heat throttles itself pretty heavily whenever this happens, which prevents me from working (or doing anything) on the laptop for a while!
Maybe it is finally time to investigate.
ETW ftw
I decide to use my goto solution: Capturing an ETW trace and using Windows Performance Analyzer (WPA) to see which function frames are using a lot of CPU resource.
One of the most annoying problem with this solution is that I need to know when to capture an ETW trace, but I have no idea when the appraisal service would run. Stopping and restarting this service from the Services management console does not trigger this behavior. Therefore, the only thing I could do was keeping ETWController running and, starting an ETW trace as soon as I notice CPU hogging caused by the appraisal service.
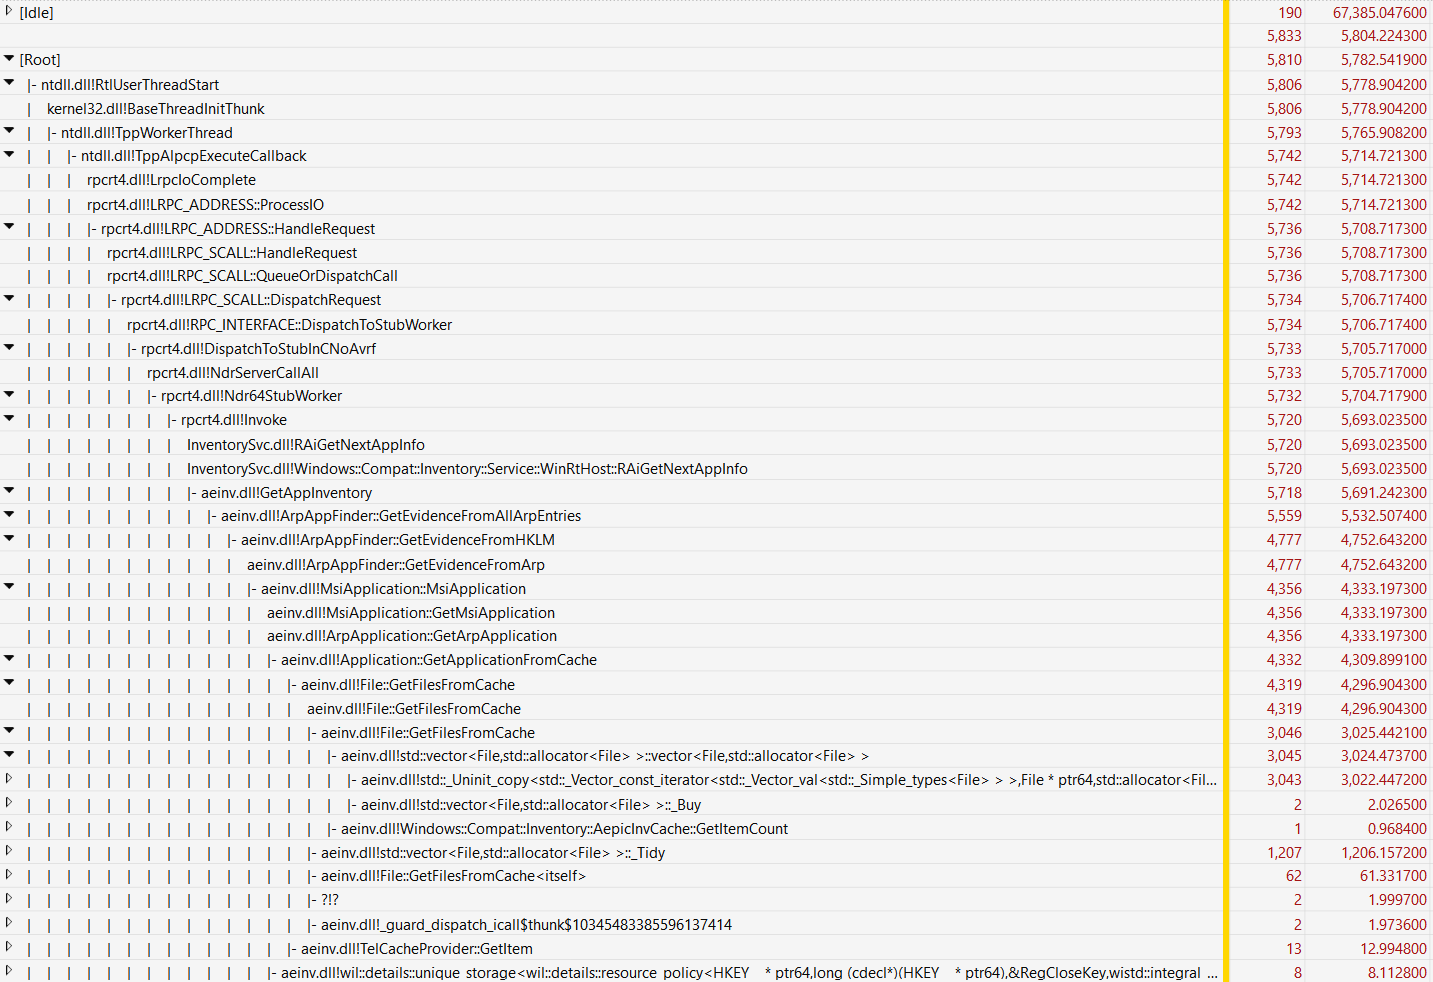
It took a few weeks before I got lucky and managed to capture a few seconds of the appraisal service running. Here is a screenshot of the CPU Usage view, which quickly points to the immediate cause of the CPU hogging problem:
Why is std::vector creation taking 3 seconds out of 5.8 seconds of the total execution time?
Now it’s time to reverse engineer the culprit binary, in this case, aeinv.dll.
Reproducing the CPU hogging behavior
Hang on - before dropping aeinv.dll into a decompiler and starting a multi-hour reverse engineering journey, can we reliably reproduce the behavior?
Reproducing the behavior is critical for debugging as well as verifying that a fix works, if I manage to create a fix later.
This turned out to be rather difficult because, as stated above, I still had no idea when the appraisal service would run, or be more specific, when the appraisal service would invoke GetAppInventory and hog my CPU.
I could not wait another few weeks to reproduce the bug.
So, how about writing a harness to load aeinv.dll and invoke this function by myself?
void* GetAppInventory(
        struct Windows::Compat::Inventory::IInventoryDataReceiver *a0,
        struct Windows::Compat::Inventory::InventoryControlParams *a1,
        const char *a2);
Some light reverse engineering of the GetAppInventory indicated that calling this function is a bit difficult:
There are a few data structures (IInventoryDataReceiver and InventoryControlParams) that I must properly set up to call this function, and I do not know how to initialize them!
So I took a look at the callers of GetAppInventory in aeinv.dll and found another function, UpdateSoftwareInventoryWTCEx, which calls GetAppInventory and has a quite clean interface to use.
A potentially helpful finding is that some functions down the call tree call AslLogCallPrintf to print out logging messages.
A pointer to AslLogCallPrintf is at offset 0x1140f0, so my harness can overwrite this pointer with a valid function.
If my harness runs properly, we will get some logging output!
Below is the harness that invokes UpdateSoftwareInventoryWTCEx in aeinv.dll.
#include <stdarg.h>
#include <cstdint>
#include <iostream>
#include <chrono>
#include <Windows.h>


struct CtrExArgs
{
    uint64_t unknown;
    uint64_t timestamp_0;
    uint64_t timestamp_1;
    uint64_t unknown_2;
    uint64_t handle;
};


void AslLogCallPrintf(uint64_t a0, char* title, uint64_t a1, char* format, va_list arg_list)
{
    printf("\n");
    printf("title: %s\n", title);

    wchar_t buffer[1024] = { 0 };
    // convert format to wide string
    mbstowcs(buffer, format, sizeof(buffer) / sizeof(wchar_t) - 1);
    vwprintf(buffer, arg_list);

    printf("\n");
}


int main()
{
    // load the Aeinv.dll library
    HMODULE hModule = LoadLibraryA("Aeinv.dll");
    if (hModule == NULL)
    {
        std::cerr << "Failed to load Aeinv.dll" << std::endl;
        return 1;
    }
    std::cout << "Aeinv.dll loaded successfully" << std::endl;
    // declare the function pointer
    void (*UpdateSoftwareInventoryWTCEx)(struct CtrExArgs* args);

    struct CtrExArgs args = {};
    args.unknown = 0;
    args.timestamp_0 = 0;
    args.timestamp_1 = 0;
    args.unknown_2 = 0;
    args.handle = 0;

    UpdateSoftwareInventoryWTCEx = (void (*)(struct CtrExArgs*))GetProcAddress(hModule, "UpdateSoftwareInventoryWTCEx");
    if (UpdateSoftwareInventoryWTCEx == NULL)
    {
        std::cerr << "Failed to get address of UpdateSoftwareInventoryWTCEx" << std::endl;
        FreeLibrary(hModule);
        return 1;
    }

    std::cout << "Overwriting the logging printf function pointer..." << std::endl;
    uint64_t func_ptr = (uint64_t)hModule + 0x1140F0;
    *(uint64_t*)func_ptr = (uint64_t)&AslLogCallPrintf;

    std::cout << "Calling UpdateSoftwareInventoryWTCEx..." << std::endl;

    // elapsed time
    std::chrono::steady_clock::time_point begin = std::chrono::steady_clock::now();
    UpdateSoftwareInventoryWTCEx(&args);
    std::chrono::steady_clock::time_point end = std::chrono::steady_clock::now();

    std::cout << "Time elapsed: " << std::chrono::duration_cast<std::chrono::seconds>(end - begin).count() << "[s]" << std::endl;

    FreeLibrary(hModule);
}
Note that I hardcoded the offset of the
AslLogCallPrintffunction pointer for theaeinv.dllthat I have on my machine (version 10.0.26100.5074, SHA256b50db3c6aa9542d0fbf571c4415618622a8f3a4c051984b11c69ff1dc971e3ed). You may need to adjust the offset if you want to run my harness with a differentaeinv.dll.
I ran my harness to ensure that the behavior is similar to what I observed before.
Aeinv.dll loaded successfully
Overwriting the logging printf function pointer...
Calling UpdateSoftwareInventoryWTCEx...

<A bunch of logging messages removed>

title: AppvAppFinder::EnumeratePackages
RegOpenKeyEx failed to open versions key: 9ac08e99-230b-47e8-9721-4577b7f124ea\Versions, (2)

title: ArpApplication::GetArpApplication
ArpApp >>>>>>>>>>> NVM for Windows , Ecor Ventures LLC, , 65535

title: ArpApplication::GetArpApplication
ArpApp >>>>>>>>>>> JProfiler 15.0.2, ej-technologies GmbH, 15.0.2, 65535

title: ArpApplication::GetArpApplication
ArpApp >>>>>>>>>>> 7-Zip ZS 21.03 ZS v1.5.0 R2 (x64), Igor Pavlov, Tino Reichardt, 21.03 ZS v1.5.0 R2, 65535

...
My harness did not crash, and each ArpApp corresponds to an installed application on my machine, so that’s good.
It would take 2 to 10 seconds before printing out an app record, which is probably just too slow – what’s going on?
I opened Task Manager and immediately saw MsMpEng.exe hogging my CPU.
Sigh… I guess the application inventory procedure involves disk scanning (which makes a lot of sense), which would rightfully trigger virus scanning of Defender and bias my debugging.
I turned off Defender and tried again.
Aeinv.dll loaded successfully
Overwriting the logging printf function pointer...
Calling UpdateSoftwareInventoryWTCEx...

<A bunch of logging messages removed>

Time elapsed: 27 [s]
OK, the call took 27 seconds to complete, which is pretty slow and uncomfortable. It did peg an entire CPU core the whole time as I anticipated.
Before beginning my reversing journey, I decided to capture another ETW trace (this time with my harness running) just to be extra sure of the expected behavior:
std::vector copy should take most of the run time.
Much to my surprise, I got a different trace this time.
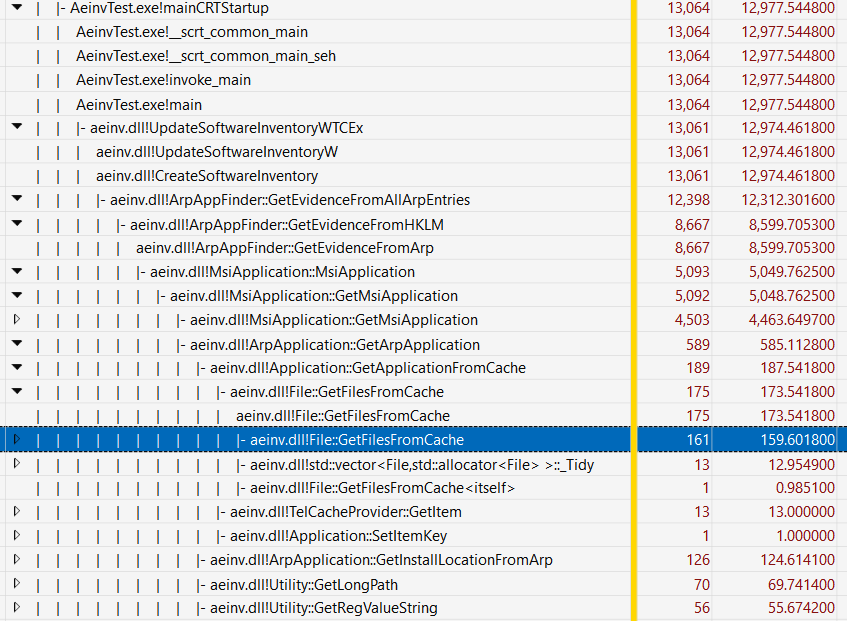
Wait what?
Why is GetMsiApplication using most of the time?
Why is GetFilesFromCache so fast all of a sudden?
Where is the std::vector creation and copy logic in the trace?
I quickly realized that I was running my harness as a normal user while the appraisal service was running as a SYSTEM user.
So it probably failed somewhere when building the inventory of applications on my system?
I know for example that C:\Windows\Installers is not accessible by normal users without sufficient privileges.
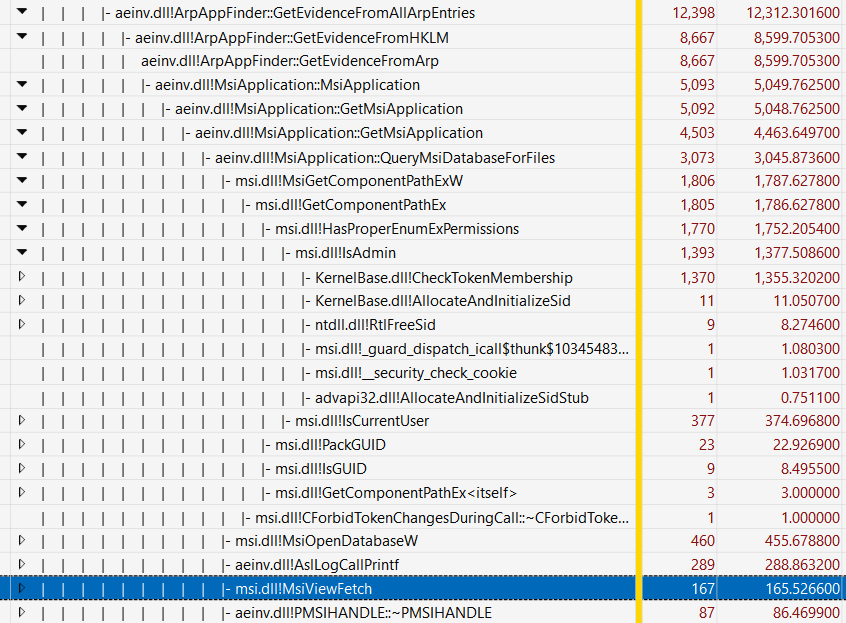
Expanding MsiApplication::GetMsiApplication revealed that my suspicion was at least partially reasonable.
A call to function msi.dll!IsAdmin took 1.3 seconds in total.
To me, this
IsAdmincall is still suspiciously slow because it is totally something that can be cached for a process. It should not be called again and again! But it is a problem for another day. Let’s focus!
Alright, we need proper permissions. I reran my harness with administrator privileges and captured yet another ETW trace. This time I reproduced the expected behavior: The vector copy and allocation logic took 11 seconds out of a total of 20 seconds.
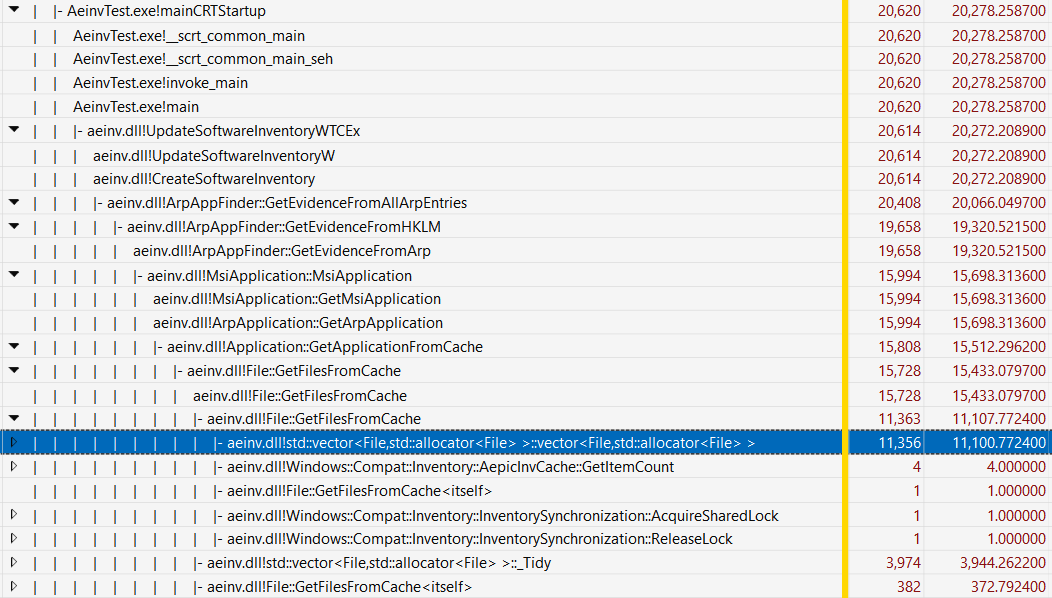
It must be a really important vector, or a vector with really important File objects…
Understanding the (decompiled) code
Now I can drop aeinv.dll into my favorite decompiler.
Thanks to the awesome debug symbols that Microsoft provides, the decompilation of File::GetFilesFromCache(TelCacheProvider *) immediately revealed exactly one place where std::vector<File>::vector<File>() is called:
at the end of the function, right before returning:
std::vector<File> File::GetFilesFromCache(TelCacheProvider *cache_provider)
{
    std::vector<File> vec;
    // ... a lot of code that rebuilds the global g_file_cache vector when necessary ...
    for (j = cache_provider->GetFirstItem(&v11); j >= 0; j = cache_provider->GetNextItem(&v11)) {
        // ... code that builds a File object and pushes it to the global g_file_cache vector ...
        g_file_cache.size = g_file_cache.size + 816; /* 816 is the size of a File object */
    }
    // ...
    vec = g_file_cache;  // <----- this is where the vector copy happens!
    return vec;
}
It is entirely likely that the vec was not even declared in the original source code (so, maybe it was return g_file_cache;).
I am going with vec = g_file_cache; return vec; to make it clear that the copy constructor of std::vector<File> is called, which is the most expensive part of this function.
Note that File is a custom class with a vtable and some internal members.
The size of each File object is 816 bytes, so if there are 1000 files in the vector, we are looking at 816 KB of data being copied each time this function is called.
Honestly, copying 816 KB of data is not that bad for modern machines.
However, this is C++ code, so not only the 816-byte File objects are copied, but any internal members of File may also be copied.
What members does File have?
Let’s take a look at the decompilation of File::operator=(File const &):
File* File::operator=(File const &other)
{
    if (this == &other)
        return this;
    std::wstring::operator=(this->field_24, other.field_24);
    std::wstring::operator=(this->field_56, other.field_56);
    std::wstring::operator=(this->field_88, other.field_88);
    std::wstring::operator=(this->field_120, other.field_120);
    std::wstring::operator=(this->field_152, other.field_152);
    std::wstring::operator=(this->field_184, other.field_184);
    std::wstring::operator=(this->field_216, other.field_216);
    std::wstring::operator=(this->field_248, other.field_248);
    std::wstring::operator=(this->field_280, other.field_280);
    std::wstring::operator=(this->field_312, other.field_312);
    std::wstring::operator=(this->field_344, other.field_344);
    std::wstring::operator=(this->field_376, other.field_376);
    std::wstring::operator=(this->field_408, other.field_408);
    std::wstring::operator=(this->field_440, other.field_440);
    std::wstring::operator=(this->field_472, other.field_472);
    std::wstring::operator=(this->field_504, other.field_504);
    std::wstring::operator=(this->field_536, other.field_536);
    std::wstring::operator=(this->field_568, other.field_568);
    std::wstring::operator=(this->field_600, other.field_600);
    std::wstring::operator=(this->field_632, other.field_632);
    std::wstring::operator=(this->field_664, other.field_664);
    std::wstring::operator=(this->field_696, other.field_696);
    std::wstring::operator=(this->field_728, other.field_728);
    // ... omitted
}
Interesting… so each File object contains at least 23 std::wstring members, and each of them is copied when the File copy constructor is called.
This means that the copy constructor of std::wstring is called at least 23 times for each File object in the vector when the vector is copied.
Note that I am not entirely sure if all or any of these wstring members are actually used at run time, but the execution overhead of copying empty wstrings may still be non-trivial.
So to conclude, here is some back-of-the-envelope math:
- A
Fileobject is 816 bytes. - Each
Fileobject contains 23std::wstringmembers. - Each
std::wstringclass has at least 3 pointers (buffer, end, and capacity), so let’s say eachstd::wstringis at least 24 bytes. - Assuming the vector contains 1,000
Fileobjects, each timeFile::GetFilesFromCache()is called, we are copying 1000 * (816 + 23 * 24) = 1,368,000 bytes of data, at least.
To verify my math (I am pretty bad at math), all we need to know is that (a) how many File objects are typically in the vector, and (b) how often this File::GetFilesFromCache() function is called during execution.
Debugging the harness
Getting the answer to (a) is fairly straightforward.
I launched x64dbg, attached to my harness (this time I did remember to launch it with administrator privilege), set a breakpoint at the call site of std::vector<File>::vector<File>() at the end of the File::GetFilesFromCache(), and resumed execution.
What did I see?
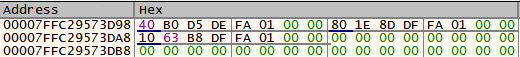
0x7ffc2957ed98 is where g_file_cache is located in memory.
The first 8 bytes is the pointer to the buffer, and the second 8 bytes is the end of the buffer.
We can calculate the length of the vector by subtracting the first pointer from the second pointer and dividing it by the size of File:
In [6]: (0x1fadf8d1e80 - 0x1faded5b040) // 816
Out[6]: 14732
So… there are 14,732 File objects in the vector, which is more than 14 times of our first guess!
Roughly speaking, each time File::GetFilesFromCache() is called, we are copying at least 18 MB of data…
Now, how often is this function called?
I pressed F9 a few times in x64dbg (to resume execution from a triggered breakpoint) and monitored the logging output of AslLogCallPrintf that I hooked up in my harness.
Apparently, File::GetFilesFromCache() is called once for every application that is installed on my machine.
title: ArpApplication::GetArpApplication
ArpApp >>>>>>>>>>> NVM for Windows , Ecor Ventures LLC, , 65535

title: File::GetFilesFromCache
Cache file count changed - refreshing file list.

<------ F9 pressed here

title: ArpApplication::GetArpApplication
ArpApp >>>>>>>>>>> JProfiler 15.0.2, ej-technologies GmbH, 15.0.2, 65535

<------ F9 pressed here

title: ArpApplication::GetArpApplication
ArpApp >>>>>>>>>>> 7-Zip ZS 21.03 ZS v1.5.0 R2 (x64), Igor Pavlov, Tino Reichardt, 21.03 ZS v1.5.0 R2, 65535

<------ F9 pressed here

title: ArpApplication::GetArpApplication
ArpApp >>>>>>>>>>> Android Studio, Google Inc., 1.0, 65535

<------ F9 pressed here

title: ArpApplication::GetArpApplication
ArpApp >>>>>>>>>>> Bochs 2.8 (remove only), The Bochs Project, 2.8, 65535

<------ F9 pressed here

...
There are probably over 500 applications installed on my machine (including Windows updates), so this function is called somewhere around 500 times, which results in copying of 9 GB of data in total.
Frankly speaking, I do not think copying 9 GB of data entirely in memory is too bad for modern machines. Of course, I would appreciate it if we do not have to copy that much data in the first place, but it is not the end of the world if we really have to…
But it was not just copying 9 GB of data in memory – somehow it triggered Microsoft Defender when building the file cache, which pegged my CPU for several minutes!
What exactly did the appraisal service do?
What are these Files?
I dumped the logging output of my harness to a file and took a closer look.
...

title: MsiApplication::GetMsiInstallDirFiles
BinDiff: Searched install dir: D:\Downloads\Software\Tools\ - 131 files found

...
This is super weird.
Like any computer user with a compulsive hoarding disorder, I organize my application installers under D:\Downloads\Software\<category>.
It looks like the appraisal service is happily scanning my download folders and building a file cache of all the files there, just for BinDiff?
I spent some more time reversing aeinv.dll and found the following logic that confirmed my suspicion:
ArpAppFinder::GetEvidenceFromAllArpEntriescollects evidence for all applications in the ARP (Add/Remove Programs) list.- For each application, this function collects evidence from the registry (e.g.,
HKLM\Software\Microsoft\Windows\CurrentVersion\Uninstall) and extract a bunch of information about the application. - The most important piece of information that is relevant here is
InstallLocation(the location of the application),InstallSource(the location of the application installer),LocationRoot,InstallPath, andProductHome(seeArpApplication::GetInstallLocationFromArp). - All locations collected above will then be passed to
MsiApplication::GetMsiInstallDirFilesto scan for executables (.exe,.dll,.cpl, and.sys) unless the location is deemed a network path or “should not be scanned.” MsiApplication::GetMsiInstallDirFilesmaps each discovered executable file to an application.- The “should not be scanned” logic is implemented in
Utility::GetDirectoriesToIgnoreForFullPathMatching, which is invokved byUtility::ShouldScanInstallDirectoryForFiles.
Utility::GetDirectoriesToIgnoreForFullPathMatching is quite long but pretty straightforward to understand.
It basically returns a list of directories that should not be scanned for executable files.
The following directories are included in this blacklist:
\Program Files (x86)
\Program Files
\Program Files\WindowsApps
<User>\AppData\Local\Microsoft
<User>\AppData\Local\Temp
<User>\Downloads
<User>\Desktop
Sadly, my download folder for application installers (D:\Downloads) is not in this list.
This is why the appraisal service searched through all my installers under D:\Downloads\Software\Tools\ and mapped all executables there (which are installers of other applications) to BinDiff.
In fact, the BinDiff installer is a single file executable and does not rely on any other files. The mapping that the appraisal service made is completely wrong.
I feel this entire logic is pretty questionable, because:
- The appraisal service assumes all executables from the location of an application installer must belong to the application itself, which is not necessarily true (and especially not true for compulsive installer horders like me). Maybe it can use soem more heuristics to better determine if the executables under an install location actually belongs to the application, instead of just assuming they do?
- The appraisal service cares about the installer locations at all. I am not sure why the installer location is relevant any longer once the application has been installed on the machine.
- Why must the appraisal service complete its job as soon as possible? I absolutely would not have cared or even noticed if it had taken 10 times longer to finish and used only 10% of a CPU core. Honestly, I feel pretty insulted when a background service that I did not ask for just decides to peg a core for over ten seconds. Please, for the sake of god, just sleep() more (but Windows just hates sleeping).
- The scanning logic of installers (and other files that are stored along with them) triggers Defender on these files. However, since these installers have been ran and the applications have been installed, why would scanning these files for virus be necessary at all?
I have absolutely no idea how to fix the behavior of the appraisal service without changing how I store my application installers locally, so I had to disable the appraisal service to prevent it from running ever.
Disabling the appraisal service
Turns out that the appraisal service can be triggered in two ways:
- A scheduled task named
Microsoft\Windows\Microsoft Compatibility Appraiserthat is triggered every six hours. - The
InventorySvcservice itself, which may be set to “Automatic” or “Automatic (Delayed Start)”.
Disabling both of them successfully prevented the appraisal service from running and pegging my CPU.
Afterword
This post has been quite long, so I will just briefly talk about some other less important findings that I had.
How is the copied vector used?
std::vector<File> File::GetFilesFromCache(TelCacheProvider *cache_provider) copies the global g_file_cache vector and returns the copy to its caller.
At least in one of its callers, the returned vector is filtered for File objects that match certain conditions and create a new vector with the copies of matched File objects.
Why didn’t File::GetFilesFromCache just return a reference to the global g_file_cache vector, so that we can avoid all the vector copying?
It also seems to me that the File objects are never modified once they are put in the g_file_cache vector.
Maybe we can make the File objects immutable and use references to them instead of copying them around?
Is it caused by a missed C++ optimization opportunity?
A friend of mine pointed this great article to me, which is about the move semantics of C++ and how it can be used to avoid unnecessary copying of vectors.
I am not a C++ expert, but it seems to me that no amount of C++ optimization could optimize away the copy that’s necessary when the function returns a global std::vector<File> variable to a local variable.
Please let me know if you think otherwise!
The weird Microsoft Defender resource usage problem
The only thing that forced me to spend hours debugging the appraisal service (and writing this blog post) is that all of a sudden, Defender began to use all of my CPU cores instead of just one core once it was triggered by the appraisal service. It seems to me that Defender introduced some buggy behavior, but I am not interested (yet) in reversing Defender to verify this hypothesis. Maybe this is a typical “it gets worse before it gets better” situation?
Let me know if you manage to find the root cause of this weird Defender behavior!
It wastes battery power!
I forgot to mention that the appraisal service would absolutely run even when my laptop is using battery power!
This actually seems like a bug, because UpdateSoftwareInventoryW has the following logic:
    else if (powerStatus.ACLineStatus != 1)
    {
        AslLogCallPrintf(3, "UpdateSoftwareInventoryW", 1209, "Not running because the system is currently on battery.");
    }
    else
    {
        count = 0;
        v30 = 0;
        v32 = CreateSoftwareInventory(4099, NULL, NULL);
    }
CreateSoftwareInventory eventually calls ArpAppFinder::GetEvidenceFromAllArpEntries to build the application inventory.
However, according to the very first ETW trace that I collected (see the screenshot above), the appraisal service directly calls InventorySvc.dll!Windows::Compat::Inventory::Service::WinRtHost::RAiGetNextAppInfo, which ends up calling aeinv.dll!GetAppInventory.
The latter does not check the power status at all before starting the inventory job.
I wonder how much battery power these bugs have wasted for Windows laptop users across the world…
Where else may the file mapping logic matter?
Microsoft Compatibility Telemetry (CompatTelRunner.exe) may also trigger these functions in aeinv.dll.
This might be one of the reasons why CompatTelRunner.exe pegs CPU cores for minutes at a time.
aeinv may look familiar to you if you have ever paid attention to setupact.log, a log file that Windows Setup creates during installation and most importantly, upgrade.
Here is a snippet of a setupact.log file that I found on my machine:
Info CONX aeinv: TRACE,MsiApplication::GetMsiInstallDirFiles,1158,Microsoft Expression Blend SDK for .NET 4: Searched install dir: C:\Program Files (x86)\Microsoft SDKs\Expression\Blend\ - 262 files found
This probably means that the same file mapping logic (and the same vector copying logic) is used during Windows upgrade. By fixing the unnecessary vector copying logic, we can probably reduce the upgrade time of Windows by tens of seconds.
Not that it is a huge deal, but who doesn’t want a slightly faster Windows upgrade experience? ;)